Graphical Analysis of Infrared Emissions from Thermally Pulsating Asymptotic Giant Branch Stars (TP-AGB) in the Small and Large Magellanic Clouds
- Overview-
- What are AGB stars? (Briefly, detail is later)
- Why study the SMC and LMC?
- How was the data collected? Time?
- Explain Life Cycle of a Star, HR diagram
- AGB Stars-
- ES and TP-AGB stages
- TP-AGB Star pattern
- Like Matt’s cycle
- Starts pulsating, expands, cools, contracts
- Balance between gravity and pressure
- Introduce the overall project (May need 2 slides)
- Collect data for SAGE and SAGEVAR (talk about them)
- Epochs (importance)
- Spitzer Space Telescope
- Mission
- Infrared
- Cooling Problem
- How I got the Data (i.e. previous work)
- Maybe screenshots of the numbers?
- What Matt, Ben, and Martha did
- Problems with the Data
- Size
- Column arrangement
- First Task (Identifying the stars with at least 12 epochs)
- Second Task (Calculating standard deviation)
- Introduce topic about noise from telescope (it was cooled)
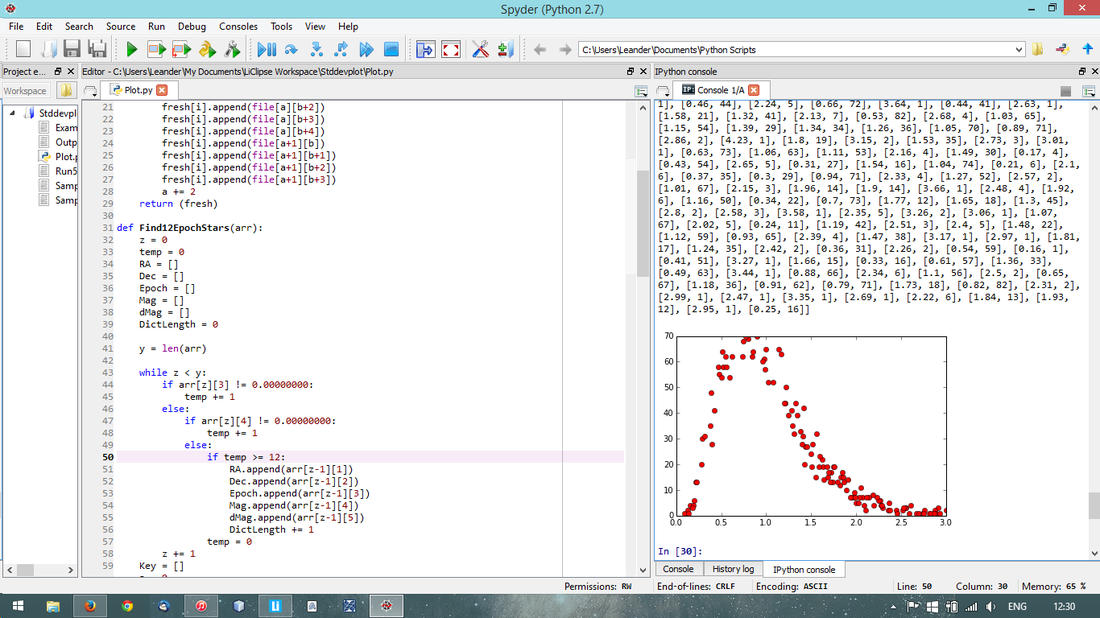
- Picture of StDev Plot
- Third Task (Normalizing the data)
- Using constant stars (explain how found), average it out
- First major problem!!
- Apply to all AGB stars
- Fourth Task (Creating Light Curve)
- Two more problems!! (Shift of columns, sort of fixed the problem)
- Each star, plot apparent magnitude vs. date (Julian date, one of the problems)
- Fifth Task (Analyzing Curves)
- Find the periods for selected AGB stars
- Graph period (time between peaks) versus average magnitude
- The main issues with the project
- Difficult to find errors, there’s millions of numbers
- What’s the point?
- Explain what these light curves are used for
- Yard sticks
- Comparison for objects further away
- Easy to study periods
- Acknowledgements
- Ben, Matt
 RSS Feed
